Trade and Services
We are chosen




Completed projects
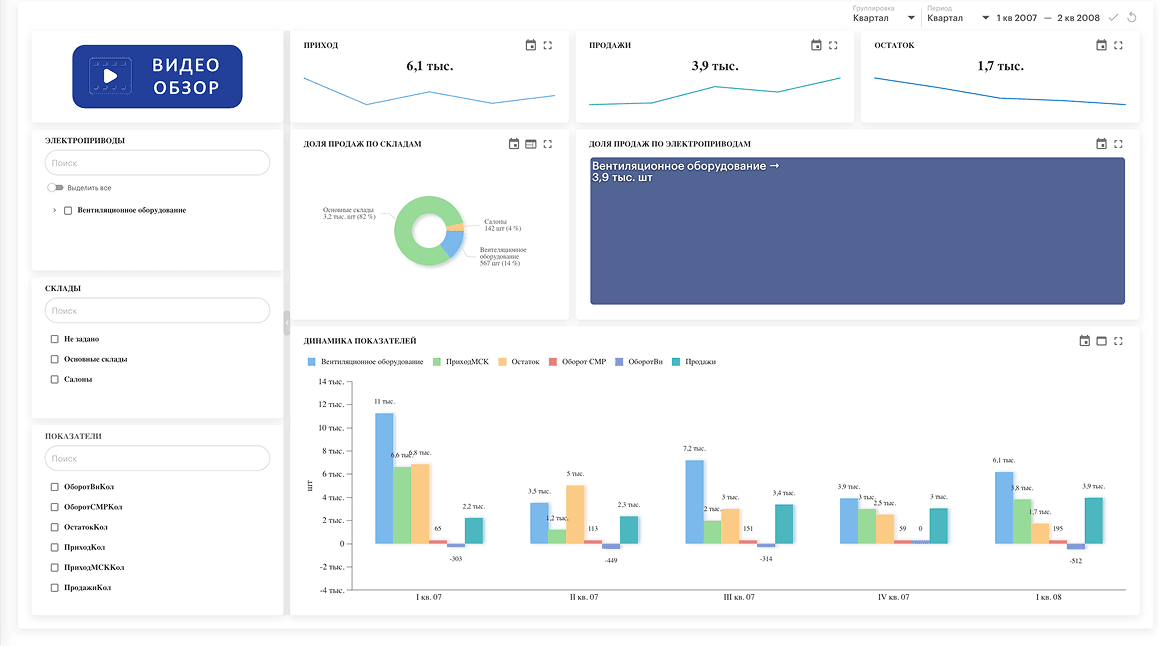
Sales analytics with advanced reporting for TEREM company
Task: Tracking the main trading indicators in different sections on one screen. Automation of product sales reporting was also an important aspect.
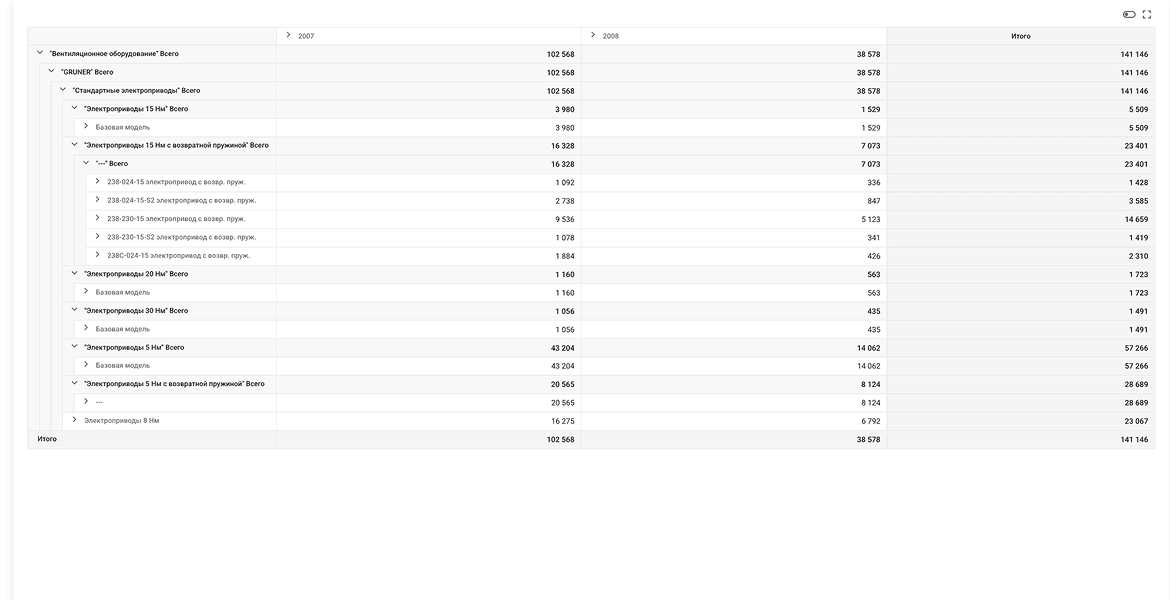
Result: we have designed a dashboard for sales and turnover analytics with the ability to filter by warehouses and trade indicators (turnover, balance, arrival). Two tabular reports and a pivot table were also made for the client.
KPI MONITOR Capabilities
On the main dashboard, you can display any strategically critical information. The broad functionality of KPI MONITOR not only allows you to track selected metrics but also refine analytics by time periods, geography, and data categories. Color indicators and a wide range of graphical data representations facilitate quick assessment of company performance.
On the main dashboard, you can display any strategically critical information. The broad functionality of KPI MONITOR not only allows you to track selected metrics but also refine analytics by time periods, geography, and data categories. Color indicators and a wide range of graphical data representations facilitate quick assessment of company performance.
Tabular reports help efficiently organize data on sales, turnover, inventory, and other critical trade indicators. They can be customized by time periods, filtered by specific parameters, and sorted as needed. Due to their functionality, such reports are particularly useful for monitoring key metrics, enabling multidimensional data analysis.
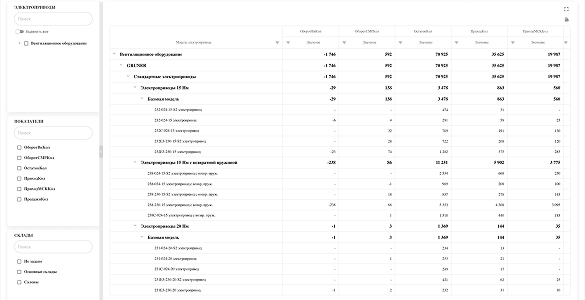
Pivot tables in trade and services instantly aggregate large datasets, enabling the discovery of hidden patterns, performance comparisons across categories, managers, or branches, and rapid generation of decision-making reports.
A dashboard for branch activity analysis enables detailed, real-time evaluation of its efficiency. It allows tracking of key metrics—daily revenue, average transaction value, conversion rates, returns, and product popularity—while promptly identifying issues or growth opportunities. This facilitates rapid adjustments to assortment, pricing, and marketing activities to maximize the profitability of individual stores.
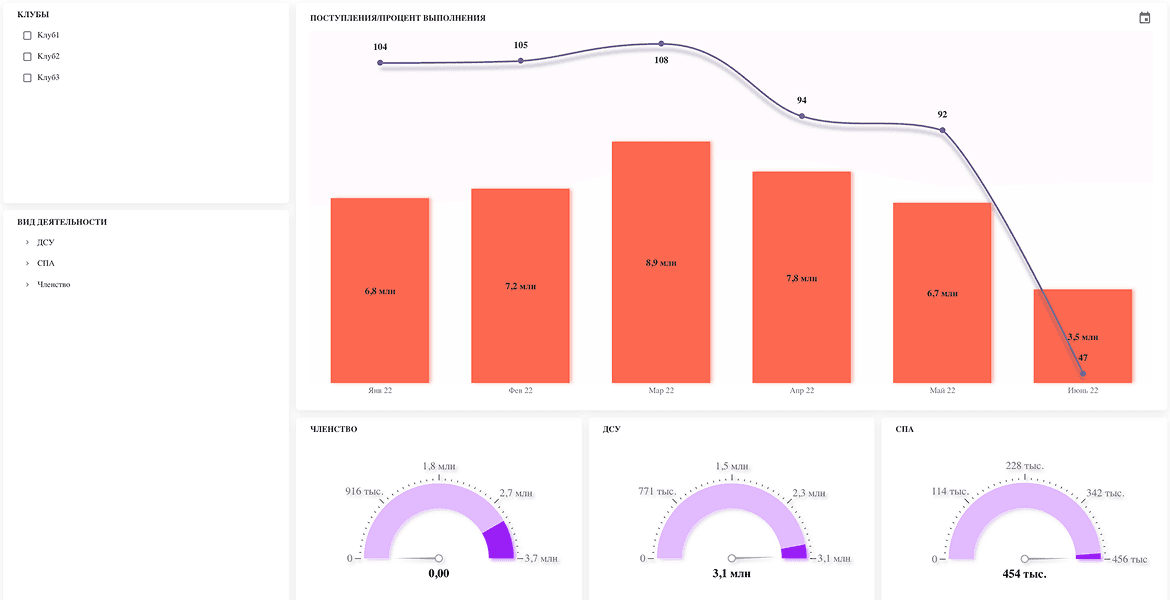
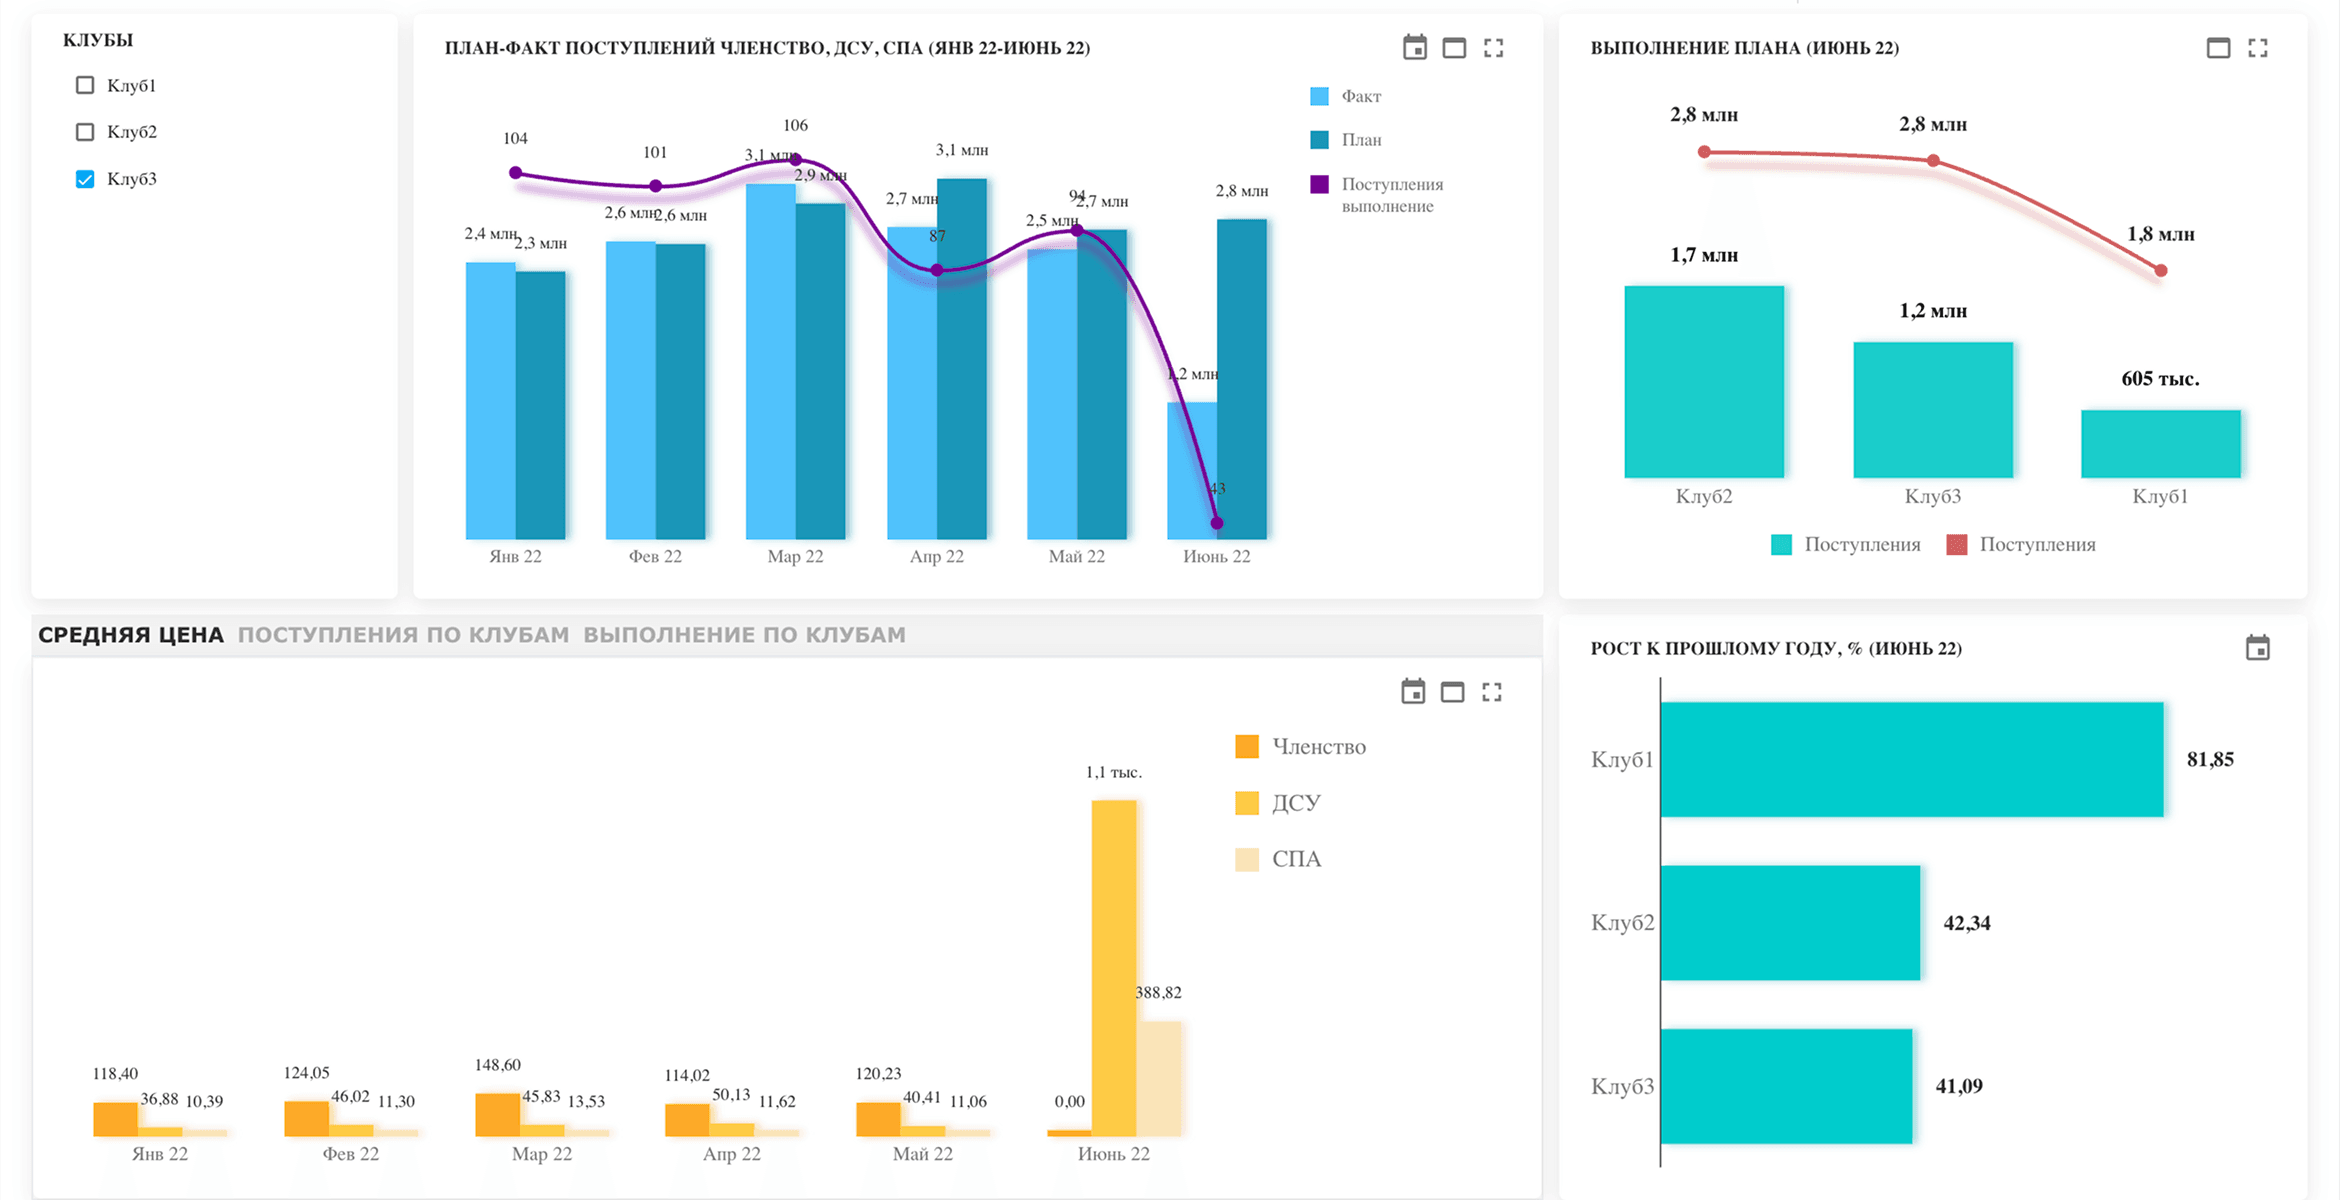
Dashboards for budget control in retail enable real-time tracking of income and expenses, prompt identification of deviations, and adjustment of financial plans. They facilitate analysis of cost efficiency, profitability monitoring, and data-driven decision-making for budget optimization. This reduces the risk of overspending and enhances the financial resilience of the business.
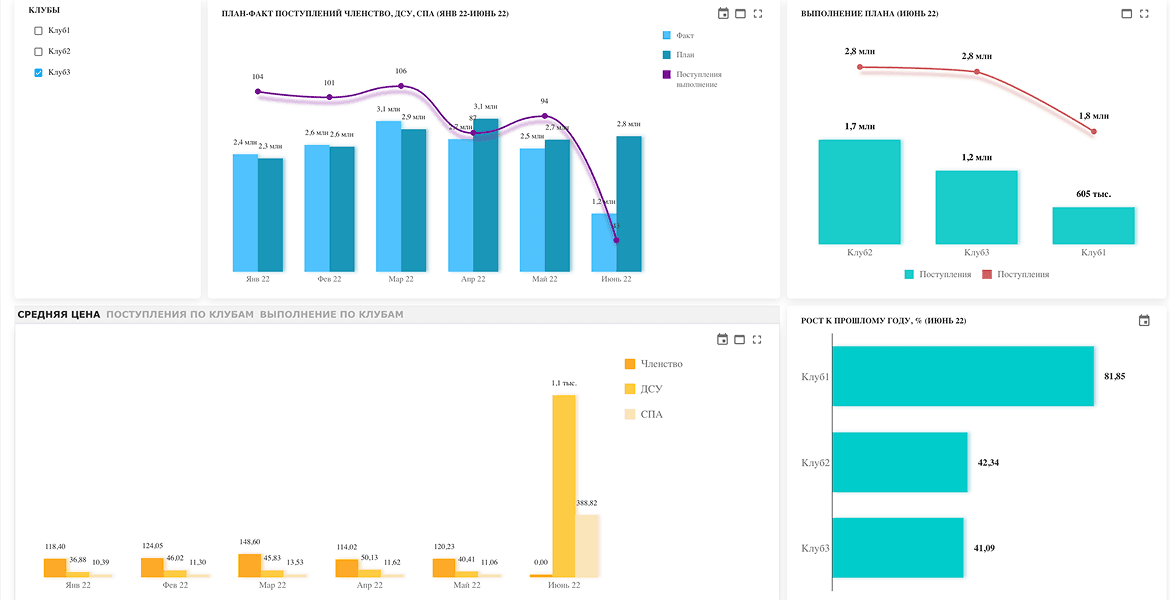
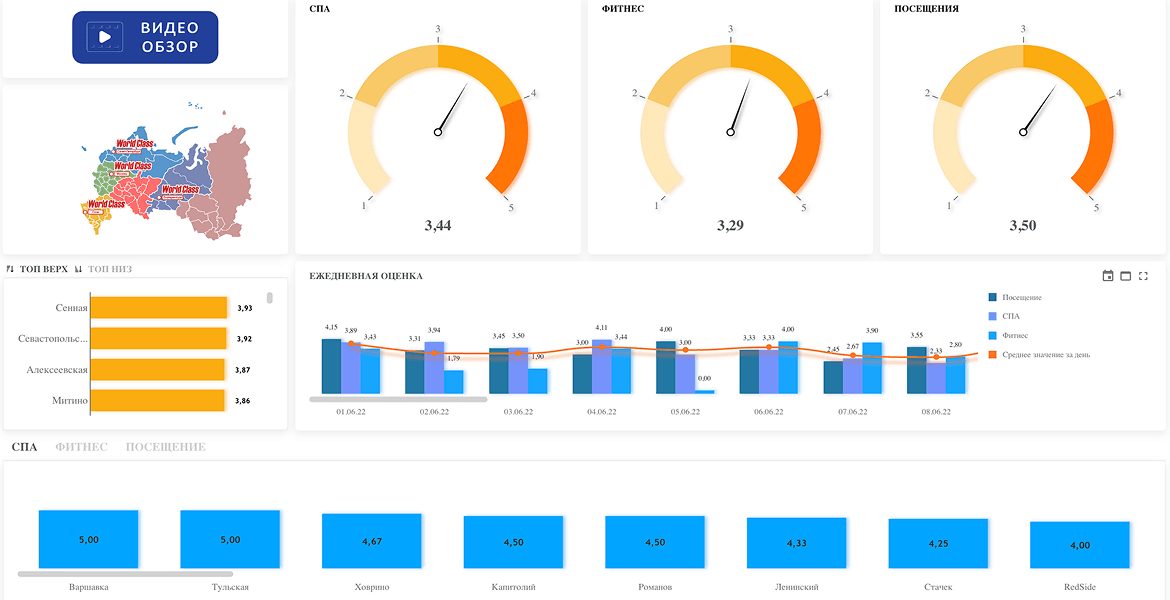
Dashboards for geographic KPI analysis enable comparison of branch performance across different cities or districts. They facilitate evaluation of key metrics—revenue, traffic, conversion rates, average transaction value—and help identify strengths and weaknesses in each region. This allows for resource reallocation, adaptation of strategies to local specifics, and overall improvement of network performance.