We cooperting with
















































Create solutions for various industries
Learn moreWatch demo
Dashboards in commerce help analyze sales, inventory, and customer behavior in real time, allowing you to make informed decisions to increase revenue and improve customer experience. Data analytics tools help identify the most profitable products and categories, and tailor marketing strategies to customer preferences. This not only increases sales, but also improves customer loyalty to the brand.
Learn moreWatch demo
Dashboards for Finance provides companies with the ability to track and analyze financial metrics such as revenues, expenses, profits, receivables and payables in real time, allowing for more informed and effective decision making.
Learn moreWatch demo
Dashboards for manufacturing provide the ability to track production performance, equipment efficiency, and product quality to help improve productivity and reduce manufacturing costs. With data visualization, bottlenecks in the production process can be quickly identified and corrective actions can be taken. Analyzing production data also helps with maintenance planning and extends equipment life.
Learn moreWatch demo
Dashboards in logistics monitor freight flows, inventory and transportation costs, enabling companies to improve supply chain management and reduce the time it takes to deliver goods. Data visualization helps to quickly respond to changes in demand and optimize delivery routes. In addition, integration with warehouse and transportation management systems improves forecast accuracy and reduces operational costs.
Learn moreWatch demo
Dashboards for the energy industry allow companies to track resource consumption, equipment performance and costs in real time to help optimize processes and improve energy efficiency. Using analytical tools, companies can identify trends and anomalies, which helps in forecasting needs and mitigating risks. It also enables better management and integration of renewable energy sources into the overall energy system.
Learn moreWatch demo
Dashboards in state government provide access to key performance indicators such as citizen satisfaction, budget expenditures, and program performance. This promotes transparency, better interaction with the public, and more efficient allocation of resources to achieve public goals.
Learn moreWatch demo
Dashboards in education allow univesities to track student performance, attendance, financial costs and resources in real time.
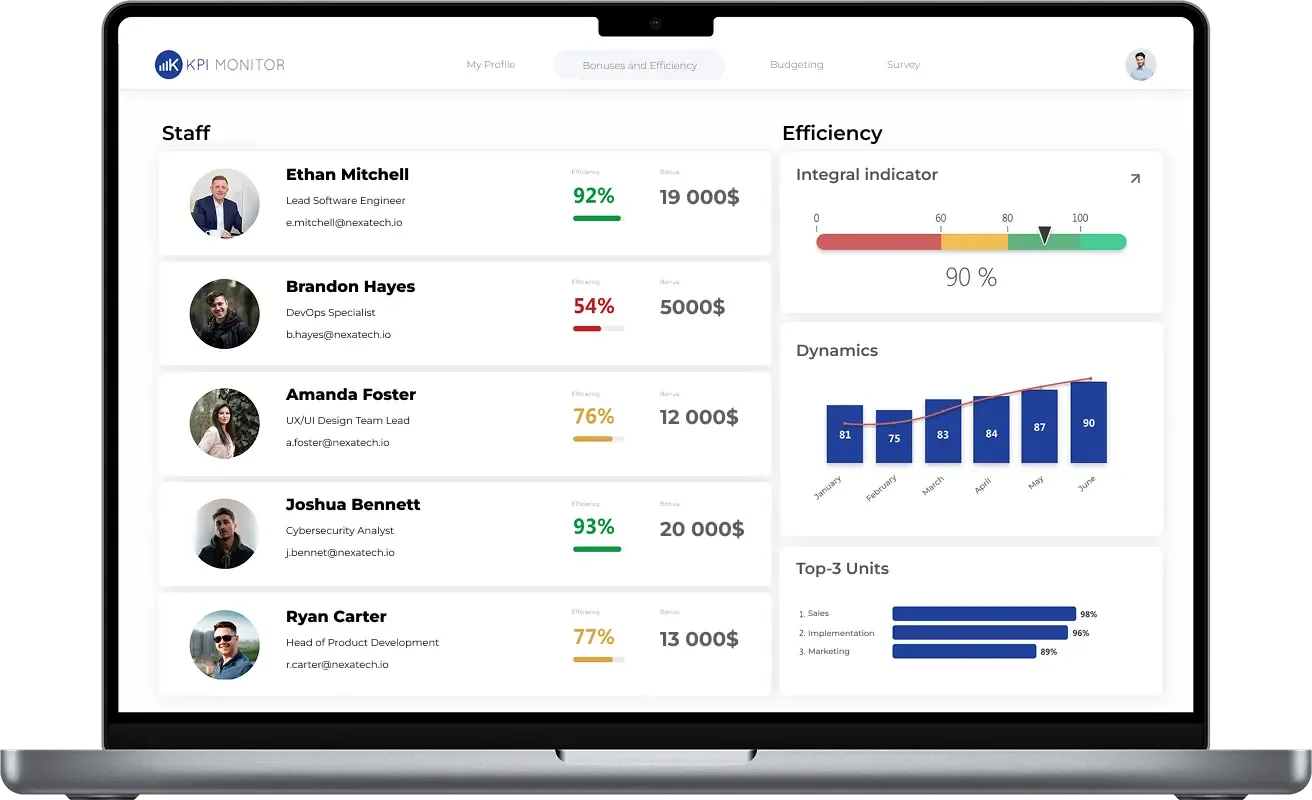
KPI MONITOR Analyzer is included in the “TURBO University” software product as a tool for visualization and calculation of university performance indicators. The TURBO University product itself is used to consolidate data from all information systems of the university and build a unified monitoring and decision-making system based on them.
KPI MONITOR's key features
Integration and consolidation
KPI MONITOR allows you to import data from accounting applications and transport files, automatically synchronizes analytical directories with the corporate system.

Interactive animated visualization
The program offers a variety of graphical charts and widgets, the ability to customize color schemes. It is possible to create tabular reports and detail data in different analytical sections.

Dashboarding
Dashboards serve to visualize key indicators and reports, supporting operational management decision-making. Customization is done individually depending on the user's needs.

Deep analysis of corporate data
KPI MONITOR supports adding an unlimited number of analytical measurements and offers tools for multidimensional data analysis. The user can quickly get detailed information about indicators and their trends with a single click.

Easy system customization and modification
The parametric settings mechanism allows users to easily configure system elements without changing the source code, which shortens implementation and administration time, reducing the total cost of ownership of the program.

Fast deployment and scalability
KPI MONITOR is accessible through any browser, enabling business collaboration independently of user location. This creates a single secure collaborative environment for the company.

KPI MONITOR allows you to import data from accounting applications and transport files, automatically synchronizes analytical directories with the corporate system.
Learn moreThe program offers a variety of graphical charts and widgets, the ability to customize color schemes. It is possible to create tabular reports and detail data in different analytical sections.
Learn moreDashboards serve to visualize key indicators and reports, supporting operational management decision-making. Customization is done individually depending on the user's needs.
Learn moreKPI MONITOR supports adding an unlimited number of analytical measurements and offers tools for multidimensional data analysis. The user can quickly get detailed information about indicators and their trends with a single click.
Learn moreThe parametric settings mechanism allows users to easily configure system elements without changing the source code, which shortens implementation and administration time, reducing the total cost of ownership of the program.
Learn moreKPI MONITOR is accessible through any browser, enabling business collaboration independently of user location. This creates a single secure collaborative environment for the company.
Learn moreLeave a request and we'll start working immediately
Quick startPresentation
Remote Online Demonstration
In-Person Solution Presentation
Specialized demo stand

Audit
Developed Methodology
Data Sources
Calculation Algorithms

Implementation
Technical specification development
System configuration
Deployment and launch