Overview of Capabilities
In an environment of rapid technological advancement and intensifying competition, businesses need to improve management efficiency by improving the quality and speed of decision-making. KPI MONITOR offers a ready-made solution for the prompt and qualitative assessment of a company’s performance through the automation of Key Performance Indicator (KPI) management systems.
Application areas
KPI MONITOR is suitable for companies of all industries and objectives, supporting both horizontal and vertical application. The program designs and automates indicator systems of any complexity, using ready-made concepts or creating unique KPIs, completely solving automation problems.
Learn moreWatch demo
Dashboards in commerce help analyze sales, inventory, and customer behavior in real time, allowing you to make informed decisions to increase revenue and improve customer experience. Data analytics tools help identify the most profitable products and categories, and tailor marketing strategies to customer preferences. This not only increases sales, but also improves customer loyalty to the brand.
Learn moreWatch demo
Dashboards for Finance provides companies with the ability to track and analyze financial metrics such as revenues, expenses, profits, receivables and payables in real time, allowing for more informed and effective decision making.
Learn moreWatch demo
Dashboards for manufacturing provide the ability to track production performance, equipment efficiency, and product quality to help improve productivity and reduce manufacturing costs. With data visualization, bottlenecks in the production process can be quickly identified and corrective actions can be taken. Analyzing production data also helps with maintenance planning and extends equipment life.
Learn moreWatch demo
Dashboards in logistics monitor freight flows, inventory and transportation costs, enabling companies to improve supply chain management and reduce the time it takes to deliver goods. Data visualization helps to quickly respond to changes in demand and optimize delivery routes. In addition, integration with warehouse and transportation management systems improves forecast accuracy and reduces operational costs.
Learn moreWatch demo
Dashboards for the energy industry allow companies to track resource consumption, equipment performance and costs in real time to help optimize processes and improve energy efficiency. Using analytical tools, companies can identify trends and anomalies, which helps in forecasting needs and mitigating risks. It also enables better management and integration of renewable energy sources into the overall energy system.
Learn moreWatch demo
Dashboards in state government provide access to key performance indicators such as citizen satisfaction, budget expenditures, and program performance. This promotes transparency, better interaction with the public, and more efficient allocation of resources to achieve public goals.
Learn moreWatch demo
Dashboards in education allow univesities to track student performance, attendance, financial costs and resources in real time.
KPI MONITOR Analyzer is included in the “TURBO University” software product as a tool for visualization and calculation of university performance indicators. The TURBO University product itself is used to consolidate data from all information systems of the university and build a unified monitoring and decision-making system based on them.
Advantages of KPI MONITOR
01
Strategic clarity
02
Effective management
03
Team synergy
04
Motivation and responsibility
Strategic clarity
- Deep business problems understanding of all the interactions of internal and external processes
- The strategic direction of operations for all departments and employees
- Targeted, concentrated allocation of all resources
- Increasing the pace of achieving strategic goals
- Deep business problems understanding of all the interactions of internal and external processes
- The strategic direction of operations for all departments and employees
- Targeted, concentrated allocation of all resources
- Increasing the pace of achieving strategic goals
- The effectiveness assessment of management decisions within the framework of the company's strategy
- Obtaining key business information in a generalized, systematized, understandable form
- Improving the interaction of employees and departments
- Employees' understanding of the company's strategic goals and their personal goals to achieve them
- Personal responsibility of the management staff and ordinary employees for the fulfillment of the indicators assigned to them
- Increase employee motivation by clarifying personal goals and objectives
Collection and processing of data
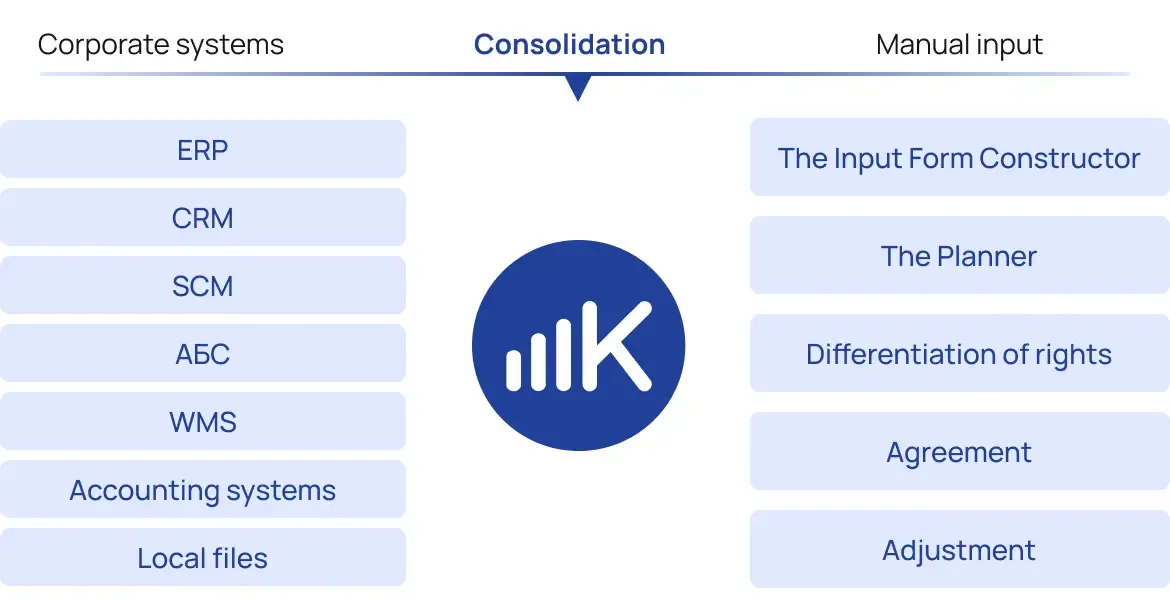
The system provides flexible integration tools for connecting with various information systems (accounting software, ERP and CRM systems, WMS, etc.) in order to collect the data required to create indicators. Additionally, KPI MONITOR supports automatic synchronization of analytical directories with corporate information systems, which provides the company with a unified system of analytics.
In the absence of an information source program, the system provides tools of data input and reconciliation directly in the program via input forms.
Setting up KPI systems
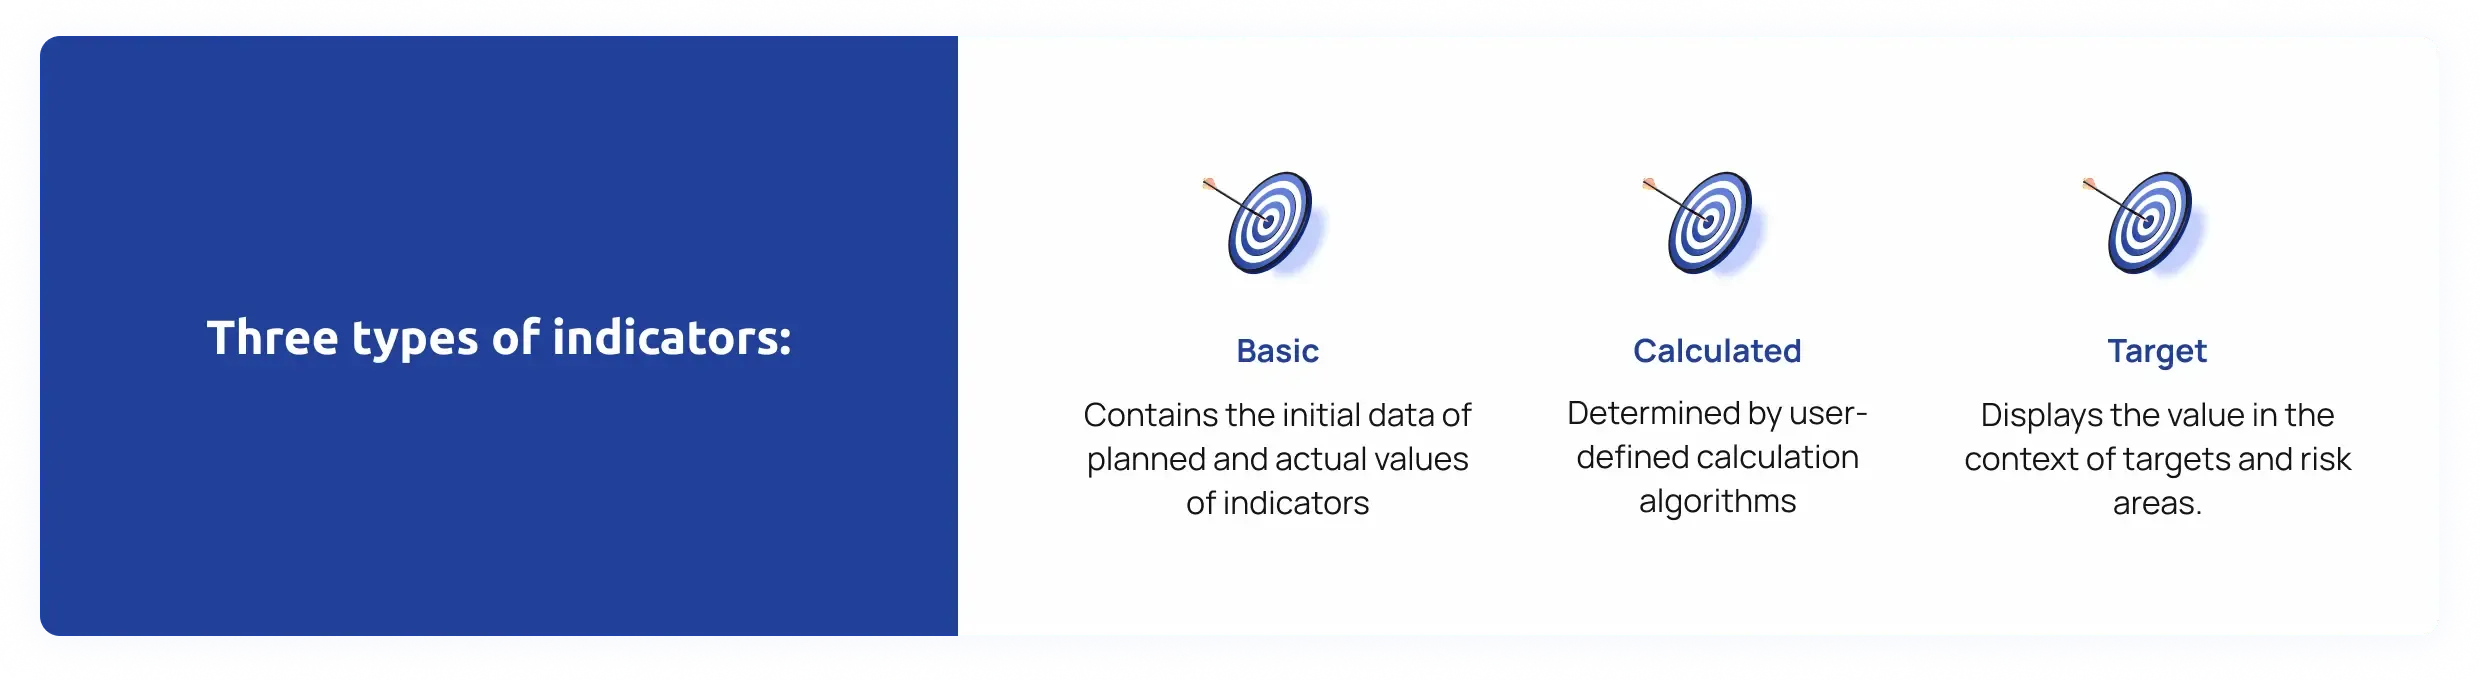
KPI MONITOR unifies all types of indicators into a coherent system, establishing multidimensional cause-and-effect relationships between financial and non-financial, key and operational indicators, aligned with the company's strategic objectives.
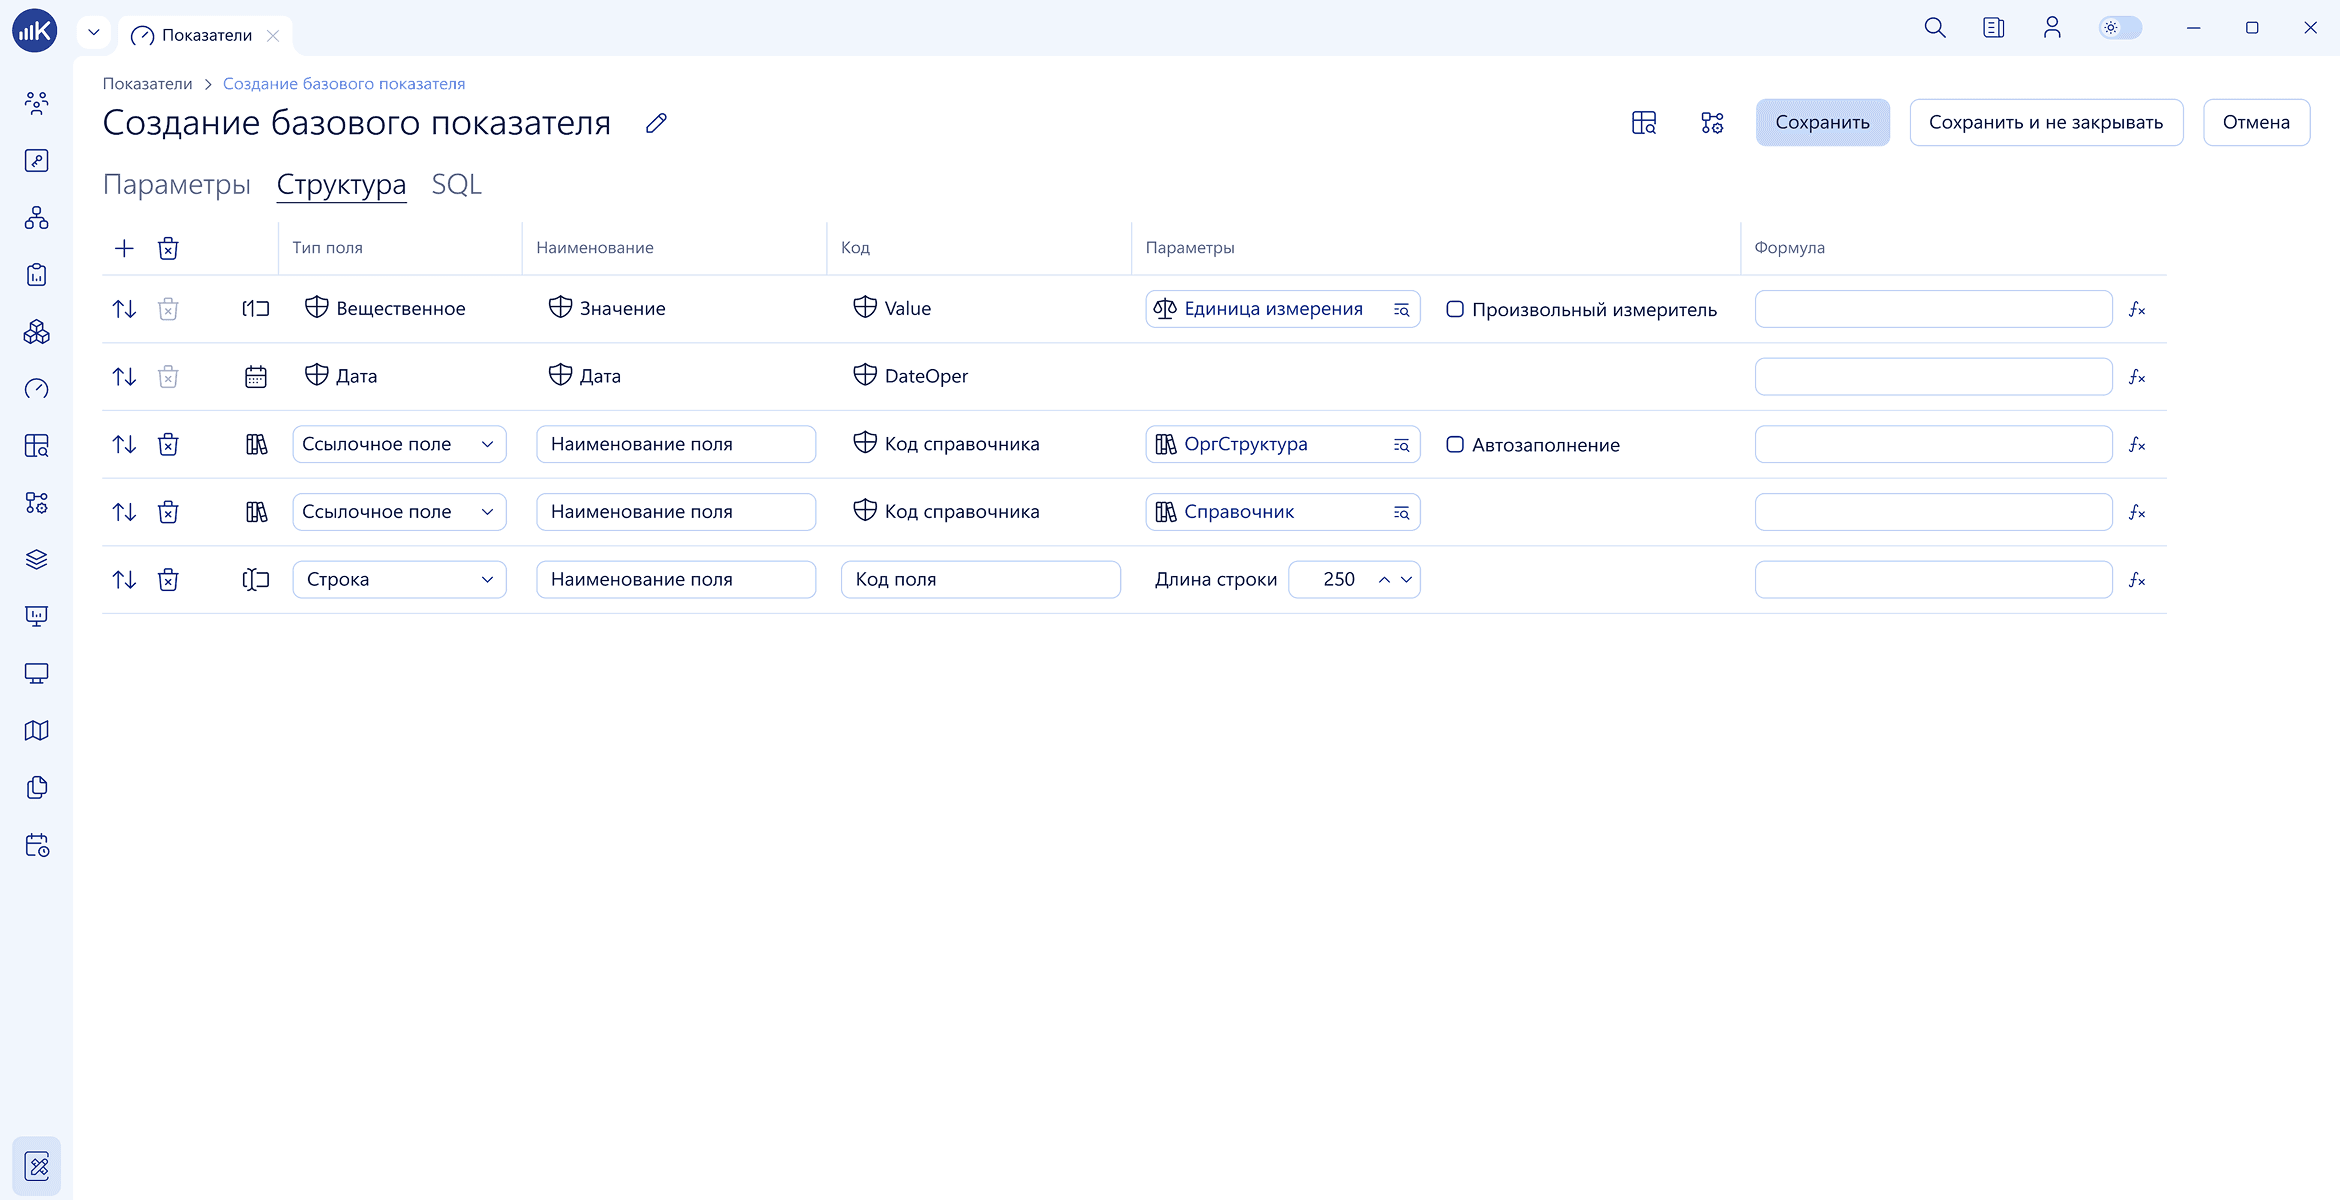
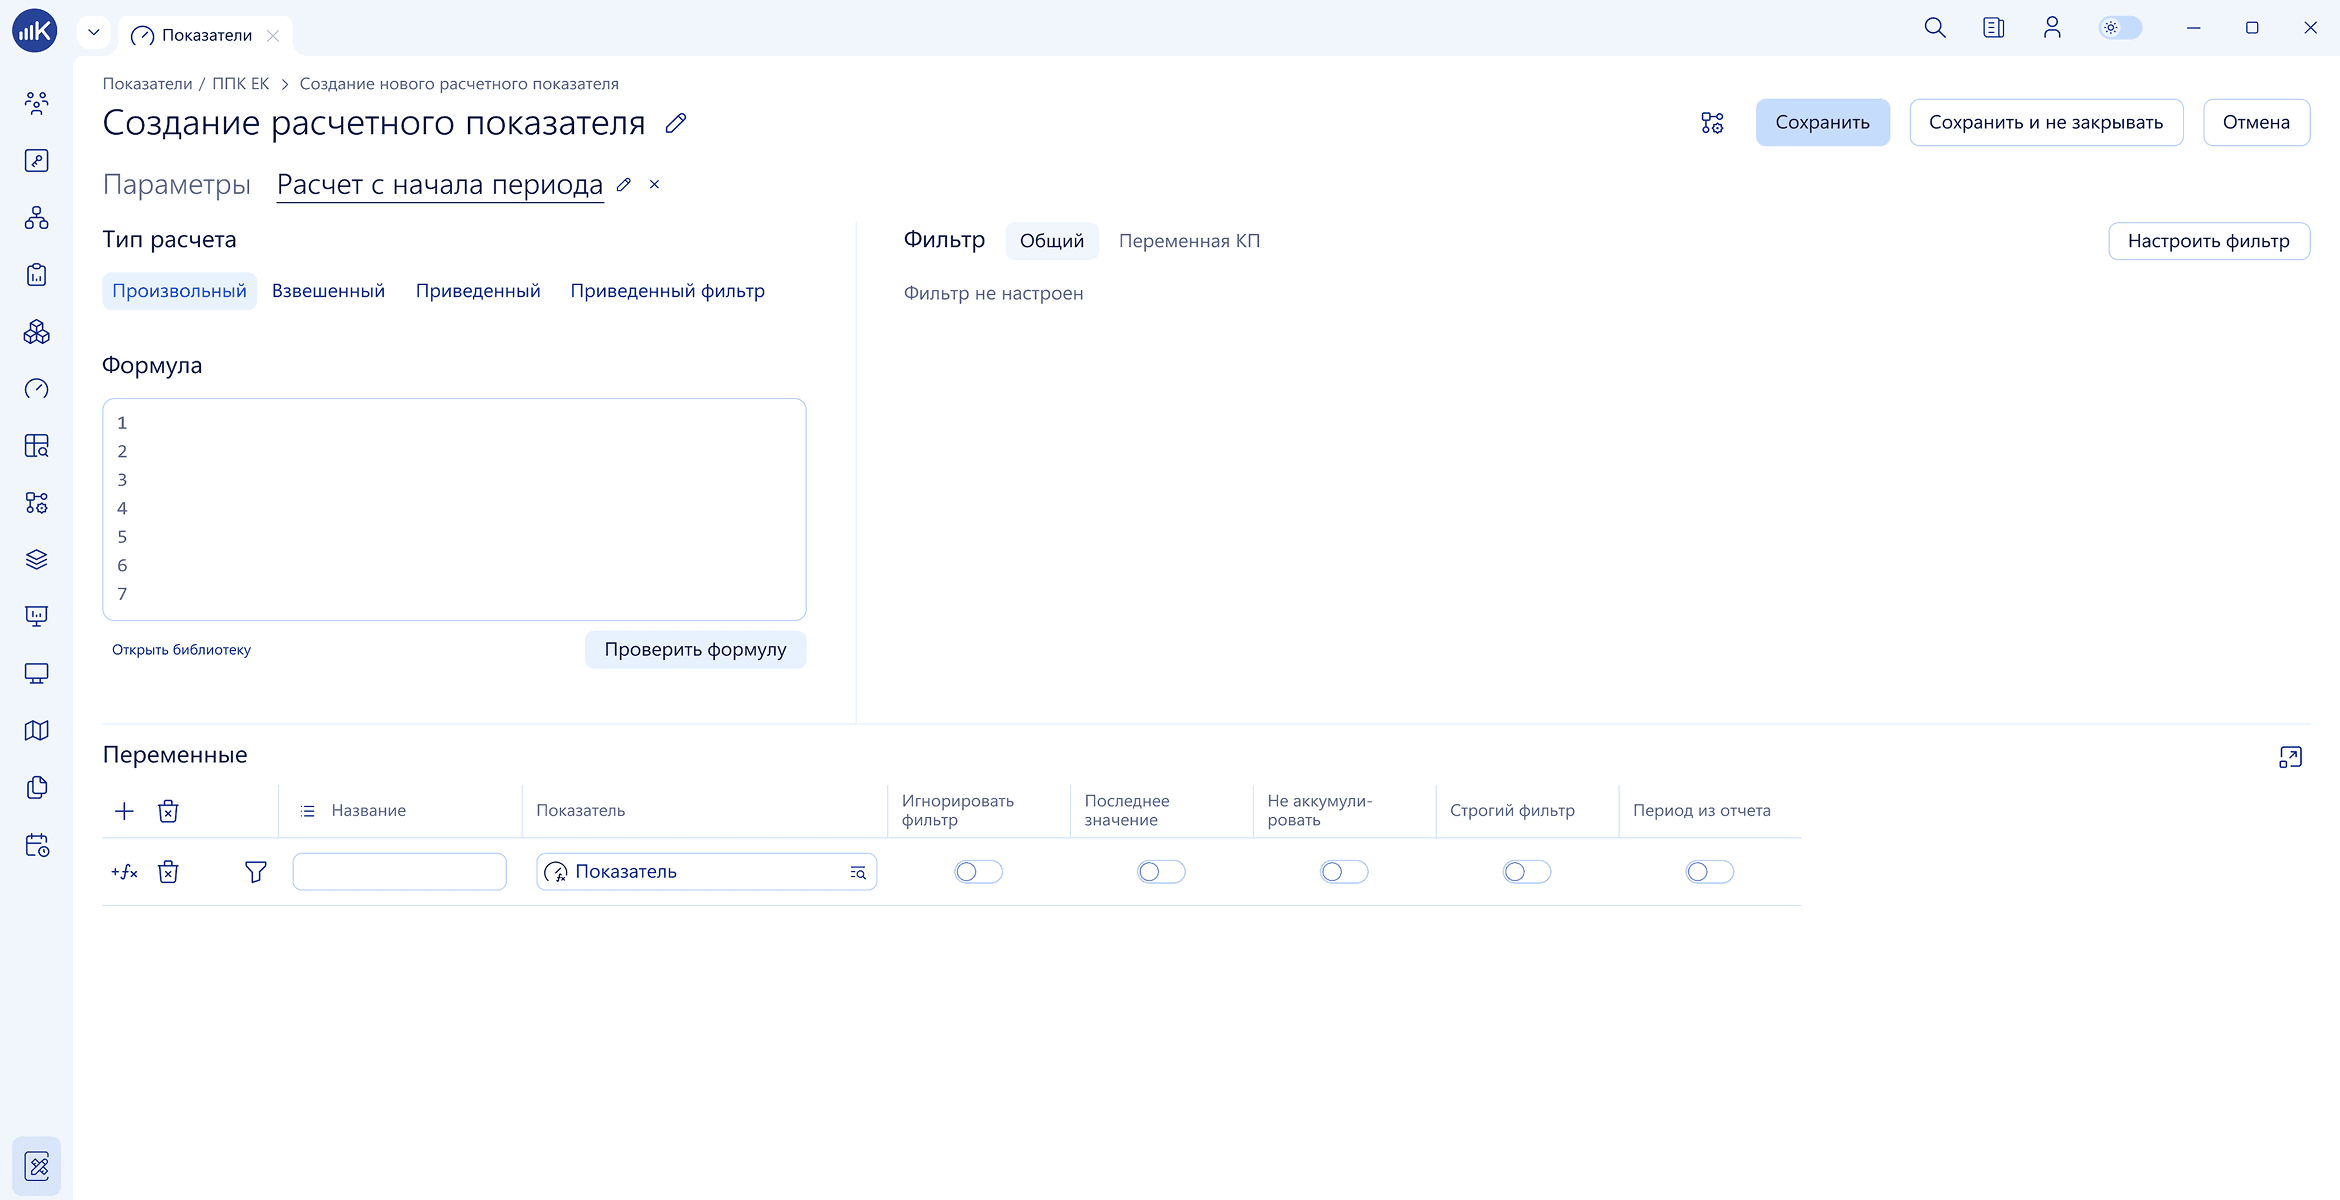
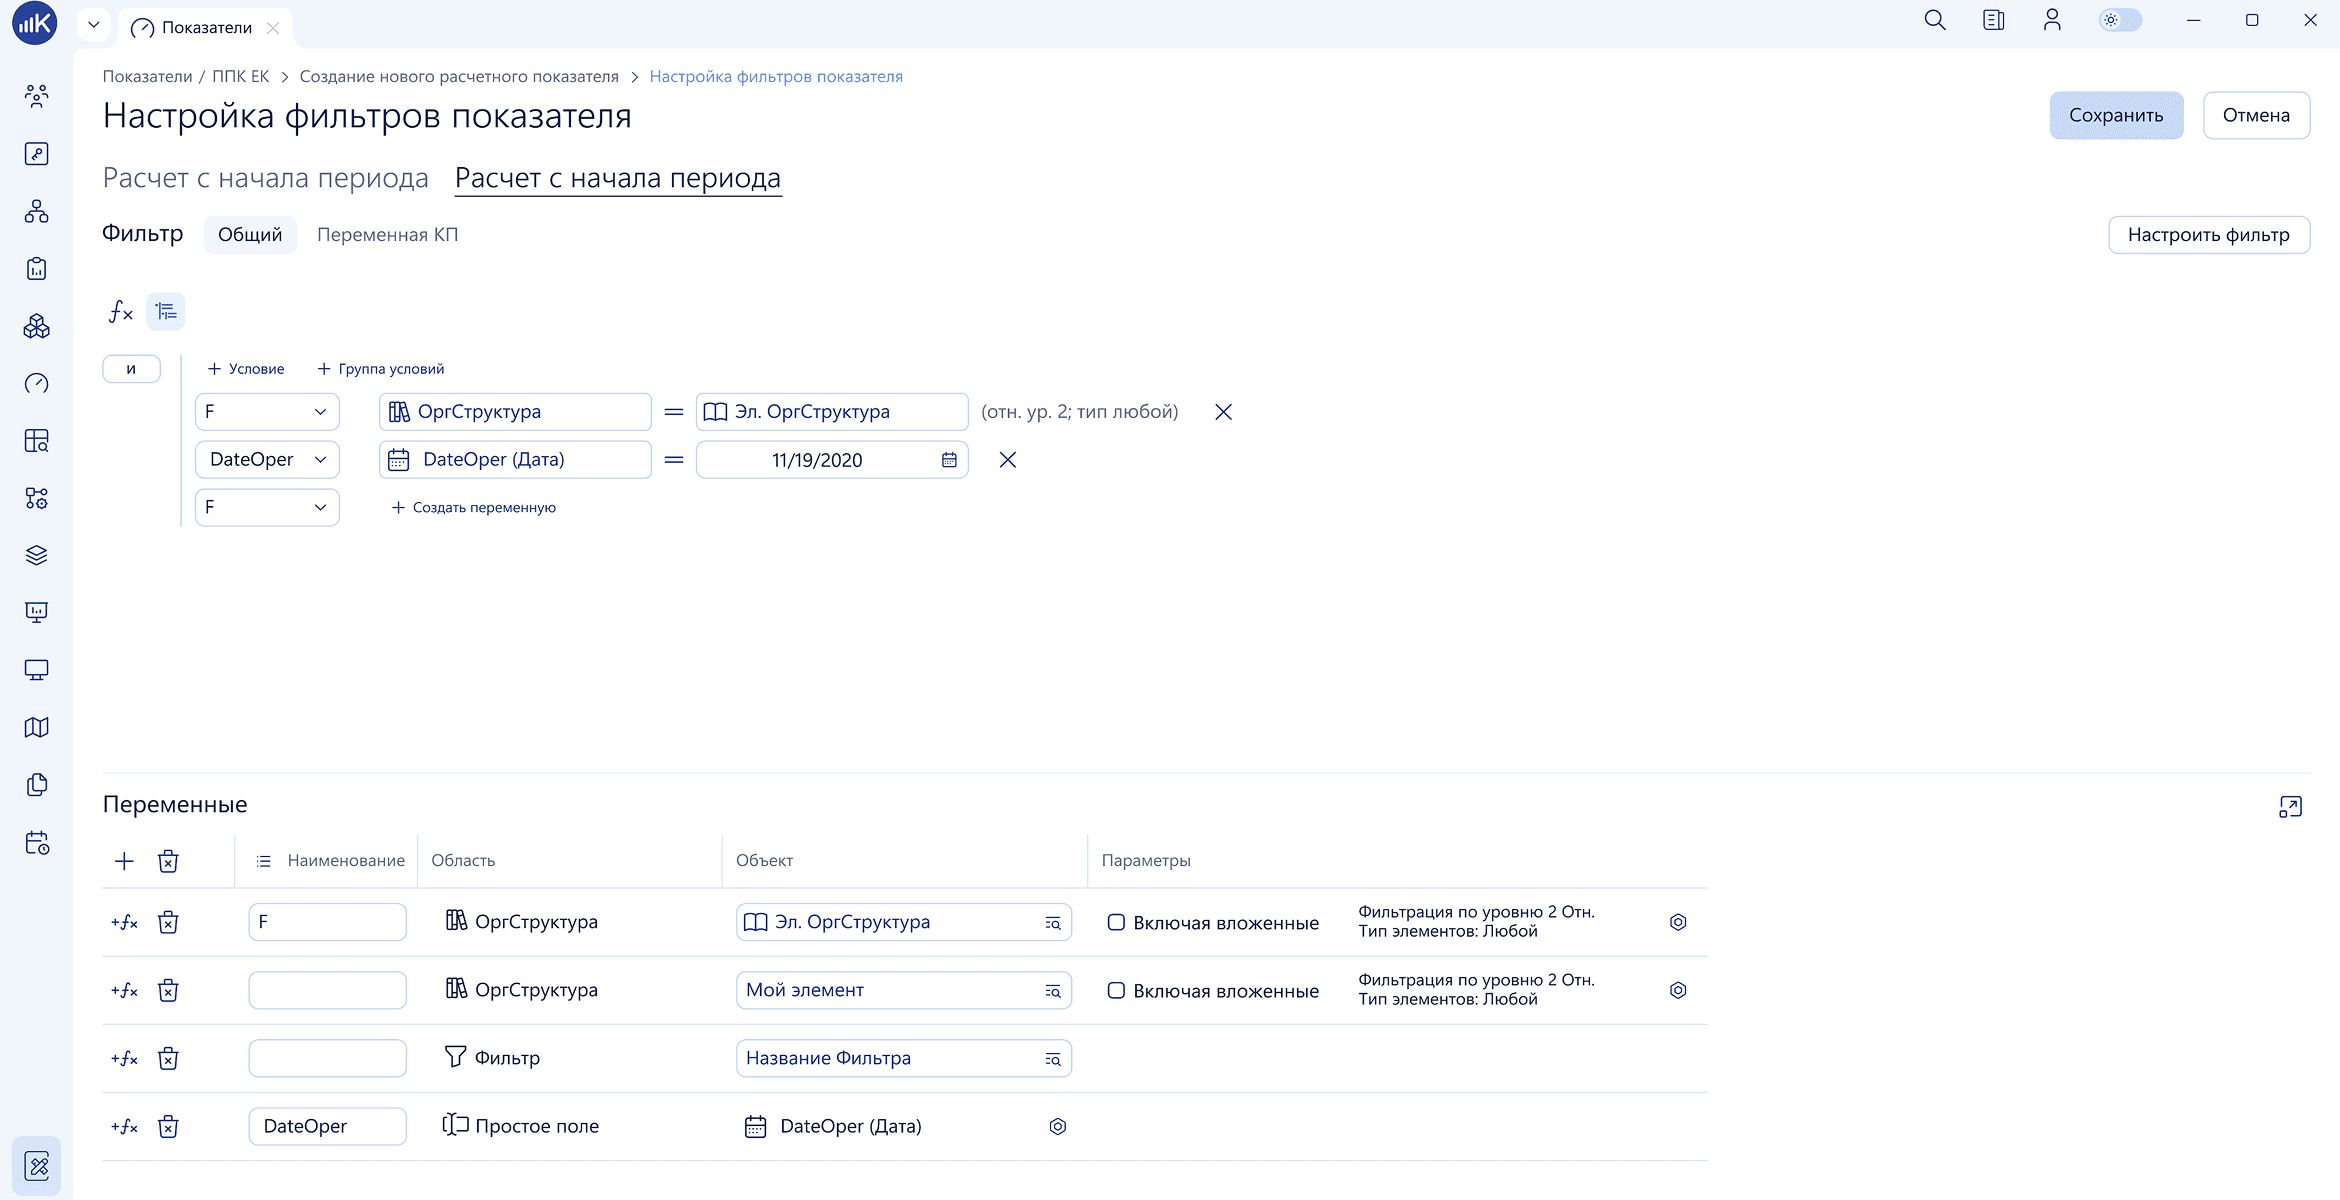
Setting Up Indicator Calculations
Interactive Visualization
Clear visualization accelerates company data analysis. The KPI MONITOR web interface delivers interactive, animated analytics. The system tracks operational and key performance indicators (KPIs), promptly notifying users of deviations via email/SMS.
Multivariate analysis